
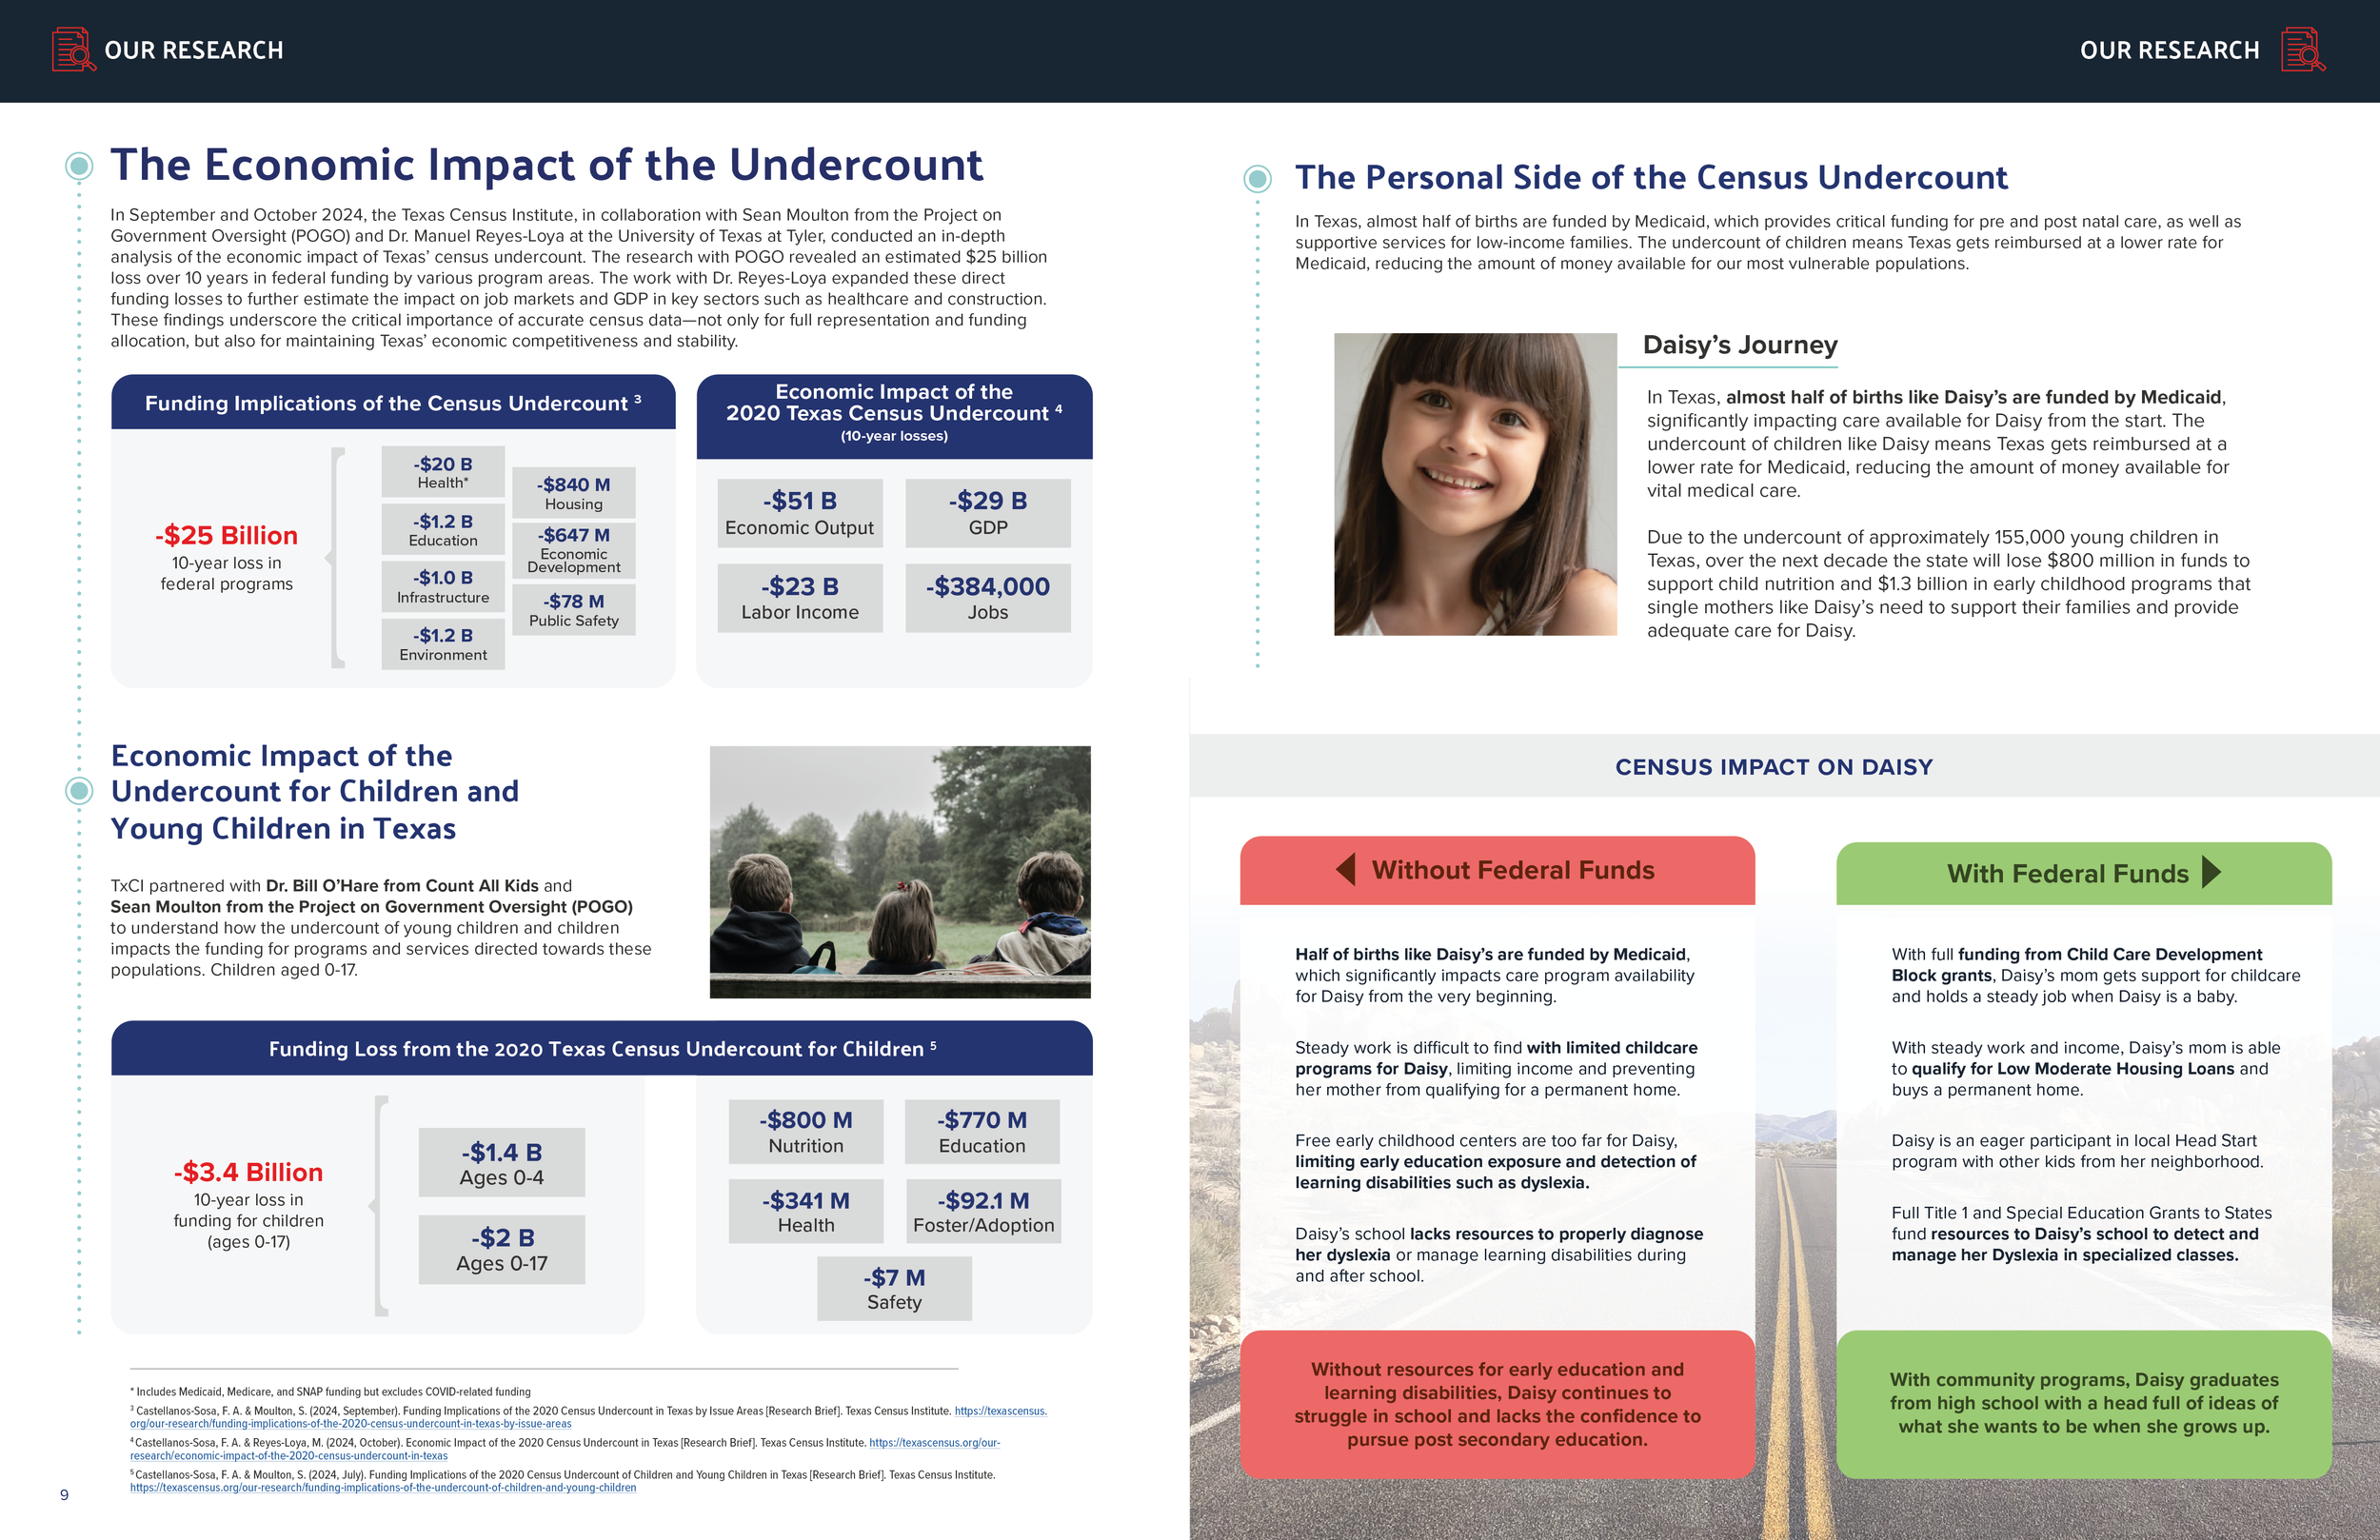
Through my design consultant role at Saddle Marketing, I had the opportunity to design the 2024 annual report for the Texas Census Institute.
I focused on creating a visually engaging and accessible representation of key data and insights. The design process involved translating complex statistics into easy-to-understand graphics, infographics, and layouts, while ensuring the report remained professional and aligned with the Institute's branding. I worked closely with the team to highlight their key findings, presenting a clear narrative through design. The final product not only communicated the critical census data effectively but also enhanced the Institute's ability to engage stakeholders and the public in the conversation about demographic trends in Texas.


MY PROCESS
In order to showcase my process and design thinking I pulled various drafts for the most complex spread in the report. This infographic had many iterations and lots of feedback from design to content. I stayed flexible and produced the best result that fit both the copy and visual side.
Original
The first file I received for this project was a very rough draft that the designer I was working with created based off the initial request from the client. She put this together as a jumping off point so the client could start to see the design direction. The designer was looking for my interpretation of the draft with a more polished look.
Draft 1
For my first draft I focused mostly on getting the content cleaned up and everything aligned, saving more of the design elements for later once we got the overall layout closer to what the client was looking for. I changed the color of the text and some of the font weights to create more of a typographic hierarchy.
Draft 2
I received feedback asking for the the two spreads to be combined into one and to be made more visual. So I decided to make it more of an infographic rather than a traditional layout. I took the smaller graphic and ran with that design to create a web showcasing all of the partnerships that the client wanted to highlight. Before refining it I wanted to have it reviewed so I sent this version back to the client for feedback.
Draft 3
After getting a positive reaction to the last draft, I focused on polishing the design. The first problem I identified with the last version was that the text within the middle circle would not work well in print because it would get cut off by the centerfold. So I moved that over to the right page to fix the issue. I pulled the larger graphics to the left so that the text on the right could be better aligned.
Draft 4
The client loved where this spread was heading but asked me to clean up the map which I did by removing the county lines and muting the colors. They also had a couple of changes for the graphic below that and new text on the right side.
Final!
After lots of back and forth, we finally came to the final product. I was really proud of how this one turned out, especially with all of the content that needed to fit into it. If you want to see how it fit into the final report see the slideshow above.